Historically, sourcegraph.com has been the only instance. It was
connected to GitHub.com and GitLab.com only.
Configuration should be as simple as possible, and we wanted everyone to
try it on any repo. So public repos were added on-demand when browsed
from these code hosts.

Since, dotcom is no longer the only instance, and this is a special case
that only exists for sourcegraph.com.
This causes a bunch of additional complexity and various extra code
paths that we don't test well enough today.

We want to make dotcom simpler to understand, so we've made the decision
to disable that feature, and instead we will maintain a list of
repositories that we have on the instance.
We already disallowed several repos half a year ago, by restricting size
of repos with few stars heavily.
This is basically just a continuation of that.

In the diff, you'll mostly find deletions. This PR does not do much
other than removing the code paths that were only enabled in dotcom mode
in the repo syncer, and then removes code that became unused as a result
of that.

## Test plan

Ran a dotcom mode instance locally, it did not behave differently than a
regular instance wrt. repo cloning.
We will need to verify during the rollout that we're not suddenly
hitting code paths that don't scale to the dotcom size.

## Changelog

Dotcom no longer clones repos on demand.
It seems many of our doc links for code hosts are broken in production
due to a url changed from external_services to code_hosts. I did a find
an replace to update all the ones I could find.
The first attempt didn't work as there are other exit conditions for the
stream version than just calling RecvMsg until io.EOF. I found that gRPC
has a callback for onFinish, and this seems to work properly locally.

See commit number 2 for the diff over the initial implementation.

## Test plan

Verified locally that all connection counts drop to zero eventually.
This reverts commit 9185da3c3e.

Noticed there are some bad callers in worker and symbols that don't
properly return a connection. Will need to investigate and fix that
first.

## Test plan

Worked before, CI passes.
This used to exist in the HTTP world, and we currently have zero
safeguards to prevent clients from making one billion requests
concurrently.
Until we invest more into server-side rate limiting, or per tenant rate
limiting, we reintroduce this limiter, to prevent resource usage spikes.

Test plan:

Added a test suite.

---------

Co-authored-by: Geoffrey Gilmore <geoffrey@sourcegraph.com>
Since we split out this service, we lost a few metrics on call counts and latencies.
This PR adds them back.
Closes#62785
Test plan:
Ran the dashboards locally and they return data. These dashboards are a 1:1 replica of the git service observability.
Turns out I blindly copy-pasted this from elsewhere and the graphs always said
GraphQL operations, which is wrong and confused people.

Test plan:

Reads better now.
This PR adds additional observation tools and warning logs for git commands that required a lot of memory.
That should help us better identify where potential for OOMs exists and what endpoints could benefit from optimization.

```
[    gitserver-0] WARN gitserver.cleanup gitcli/command.go:307 High memory usage exec request {"TraceId": "f70c73e500ed7831207ce9a7c6dc63fb", "SpanId": "705d1dcfd0b44a06", "ev.Fields": {"exit_status": "0", "cmd_duration_ms": "1944", "user_time": "234.915ms", "cmd_ru_minflt": "10231", "cmd_ru_majflt": "7", "duration_ms": "1944", "trace": "https://sourcegraph.test:3443/-/debug/jaeger/trace/f70c73e500ed7831207ce9a7c6dc63fb", "cmd_ru_maxrss_kib": "160672", "actor": "0", "traceID": "f70c73e500ed7831207ce9a7c6dc63fb", "repo": "github.com/sourcegraph/sourcegraph", "args": "[git commit-graph write --reachable --changed-paths --size-multiple=4 --split]", "system_time": "1.679428s", "cmd_ru_inblock": "0", "cmd_ru_oublock": "0", "cmd": "commit-graph"}}
```

Test plan:

Tried this locally using some command I know will use a bunch of memory, see test output above.
The index_num_assigned metric no longer exists. This should fix a few
all the graphs that you are able to select which indexserver to look at.

Test Plan:
Noticed this omission when I was wondering if we had goroutine leaks.
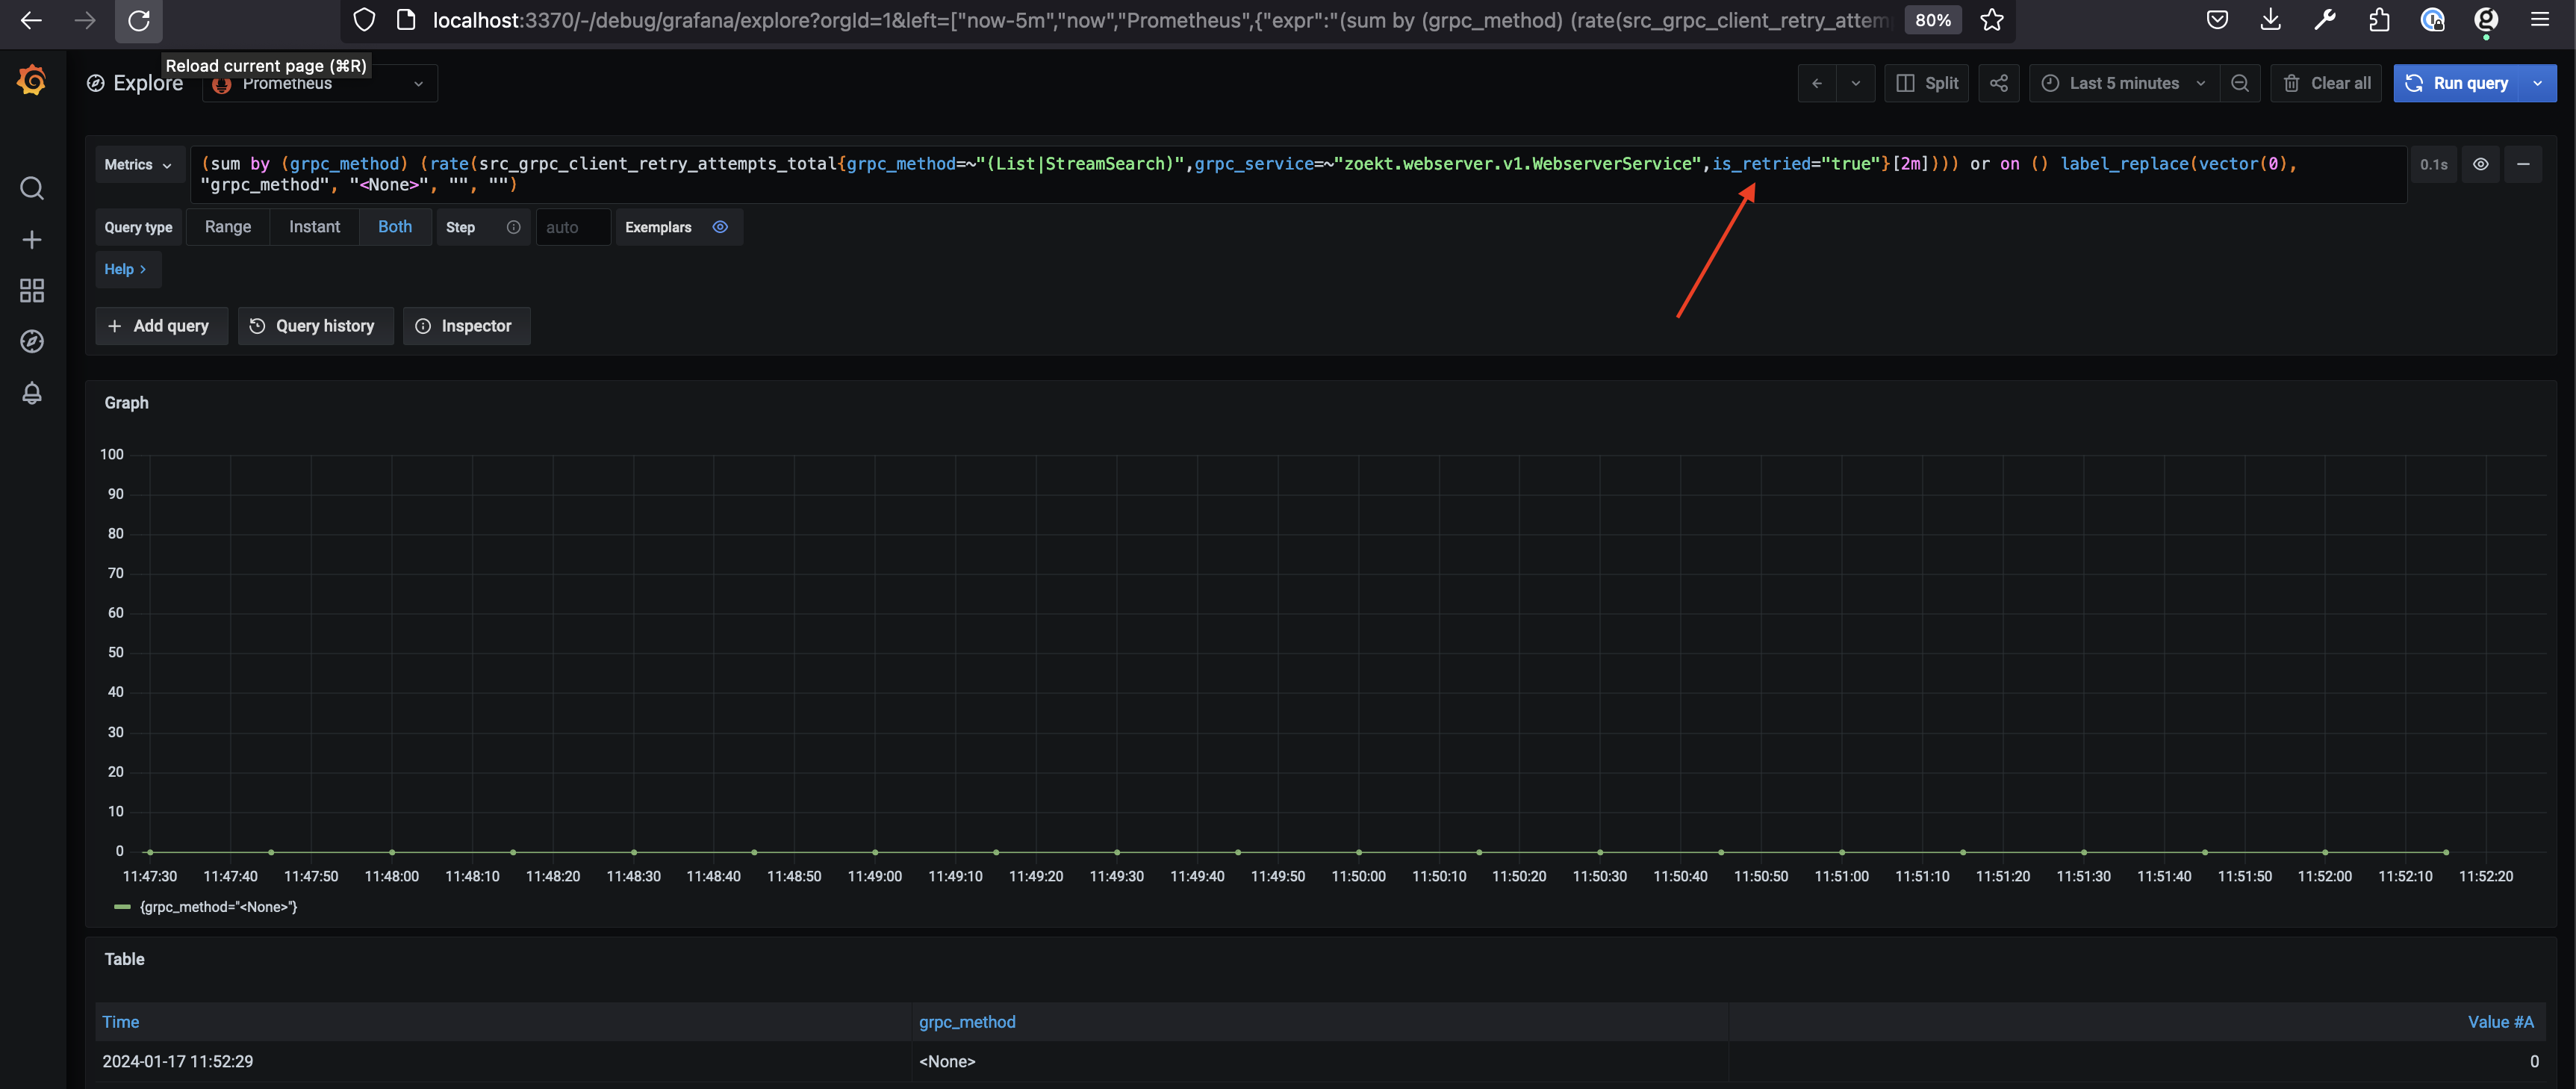
Our other services define this.
I added a simple way to indicate the container name in title since this
is the first service we added which needs this.
Test Plan: go test. Copy paste generated query into grafana explore on
dotcom.
This adds basic metrics to Rockskip and exposes them in a new panel on
the dashboard of the Symbol service.

Test plan:
- manual testing: I enabled Rockskip locally and verified that the dashboards make sense
- Removes duplicative disk IO panels
- Adds some warnings and next steps descriptions to the most critical things
- Hides the backend panel by default
- Adds a metric and alert for repo corruption events
To better track latencies and future performance improvements, adding some lightweight observability layer on top of the existing backend implementation.

I'm really no prometheus expert, this might be very wrong. I do get somewhat okay looking timing information though.
I'd love to get some additional eyes on the monitoring dashboards.

## Test plan

Ran monitoring stack locally and verified the graphs show something.
We have a number of docs links in the product that point to the old doc site.

Method:
- Search the repo for `docs.sourcegraph.com`
- Exclude the `doc/` dir, all test fixtures, and `CHANGELOG.md`
- For each, replace `docs.sourcegraph.com` with `sourcegraph.com/docs`
- Navigate to the resulting URL ensuring it's not a dead link, updating the URL if necessary

Many of the URLs updated are just comments, but since I'm doing a manual audit of each URL anyways, I felt it was worth it to update these while I was at it.
We've been running into spurious alerts on-and-off.

We should add observability here to better narrow down why
we're getting backlogs that are getting cleared later.

In the meantime, it doesn't make sense for this to
be a critical alert.
IMO, this is an unnecessary optimization that increases complexity and in the current implementation locks for longer than it needs to, because the lock in Blocking clone mode is only returned when the clone has completed, limiting the concurrency more than desired.
There are also the clone limiter AND RPS limiter still in place, so we got more than enough rate limiters in place here, IMO.
This PR consolidates and simplifies the client code a lot, in anticipation of moving more of the logic to the server-side. This allows us to have a better overview of what is actually used, and keeps the client interface as simple as possible.

Most notable changes:

- `Head` has been removed in favor of `GetDefaultBranch`. Currently, this is 1 gRPC -> 2 gRPC but with specialized endpoints, we should get it down to 1 again. They were otherwise the same, and I even noticed there's a slight bug in the `Head` implementation that didn't really handle the "empty repo" case.
- `GetCommit` no longer exposes the option to also ensure the revision exists. 99% of call sites disabled this feature and I opted for an explicit call to EnsureRevision instead. This will keep the endpoint performant and not cause latency spikes.
- `ListBranches` no longer takes options. They were unused.
- The `BatchLog` endpoint has been deprecated.
- `CommitsExist` has been removed, it's been the only method that makes use of the batch log method and accounts for probably 1500 of the deleted lines in this PR. We're now making individual requests instead. *We should monitor this, it doesn't seem like we're making crazy request counts on dotcom, our largest instance. And we have much worse offenders, like the indexserver endpoint that runs rev-parse for 3M repos.*. I do believe that with the new API, we're able to do better generic batching implementations though that aren't this specific, that also make use of gRPC streaming instead of creating very large responses and latency.
- `CommitDate` has been removed in favor of `GetCommit` which returns the date as well, one less endpoint.
- `GetCommits` has been unexported from the client API, it was only used internally.
- `Addrs` has been unexported.
- The unused properties `RefGlob` and `ExcludeRefGlob` have been removed from `RevisionSpecifier`, they were unused.
We discovered recently that the definition for the alert that fires if the site configuration hasn't been fetched within 5 minutes strips out the regex that targets individual services (since it uses a grafana variable). This means that every instance of this alert will fire if any individual service trips over this threshold.

This PR fixes the issue by adding a new `job` filter for this alert that targets only the services that have that Prometheus scrape target name. This works around the previous issue by using a fixed value for the `job` value instead of a dynamic grafana value.

The value of the job filter generally looks like `job=~.*$container_name` (following the strategy from https://sourcegraph.com/github.com/sourcegraph/sourcegraph@9a780f2e694238b5326e3e121d6a1828463001b9/-/blob/monitoring/monitoring/monitoring.go?L161 ) unless I noticed that there was different logic in the existing dashboard for the services.

Ex:

- `frontend`: already used `job=~"(sourcegraph-)?frontend"` for some metrics, so I used it again here
- `worker`: `already used `job=~"^worker.*"` in some metrics, so I used it again and standarized the other existing panels to use the same shared variable

## Test plan

I eyeballed the generated alert.md and dashboards.md to verify that my changes looked correct (that is, my refactors resulted in either no diff, or that the diff I generated still looked like valid regex).
Since we have distributed rate limits now, the last dependency is broken and we can move this subsystem around freely.
To make repo-updater more lightweight, worker will be the new home of this system.

## Test plan

Ran stack locally, CI still passes including integration tests.
In the upcoming release, we will only support gRPC going forward. This PR removes the old HTTP client and server implementations and a few leftovers from the transition.
https://github.com/sourcegraph/sourcegraph/pull/59284 dramatically reduced the `mean_blocked_seconds_per_conn_request` issues we've been seeing, but overall delays are still higher, even with generally healthy Cloud SQL resource utilization.

<img width="1630" alt="image" src="https://github.com/sourcegraph/sourcegraph/assets/23356519/91615471-5187-4d15-83e7-5cc94595303c">

Spot-checking the spikes in load in Cloud SQL, it seems that there is a variety of causes for each spike (analytics workloads, Cody Gateway syncs, code intel workloads, gitserver things, `ListSourcegraphDotComIndexableRepos` etc) so I'm chalking this up to "expected". Since this alert is seen firing on a Cloud instance, let's just relax it for now so that it only fires a critical alert on very significant delays.
In INC-264 it seems that certain alerts - such as [zoekt: less than 90% percentage pods available for 10m0s](https://opsg.in/a/i/sourcegraph/178a626f-0f28-4295-bee9-84da988bb473-1703759057681) - don't seem to end up going anywhere because the ObservableOwner is defunct. This change adds _opt-in_ testing to report:

1. How many owners have valid Opsgenie teams
2. How many owners have valid handbook pages

In addition, we collect ObservableOwners that pass the test and use it to generate configuration for `site.json` in Sourcegraph.com: https://github.com/sourcegraph/deploy-sourcegraph-cloud/pull/18338 - this helps ensure the list is valid and not deceptively high-coverage.

The results are not great, but **enforcing** that owners are valid isn't currently in scope:

```
6/10 ObservableOwners do not have valid Opsgenie teams
3/10 ObservableOwners do not point to valid handbook pages
```

I also removed some defunct/unused functionality/owners.

## Test plan

To run these tests:

```
export OPSGENIE_API_KEY="..."
go test -timeout 30s  github.com/sourcegraph/sourcegraph/monitoring/monitoring -update -online
```
updates `DatabaseConnectionsMonitoringGroup` to accept an owner - before it was just hardcoded to `ObservableOwnerDevOps`, which is not very helpful. This assigns some of the obvious service owners:

1. Source: gitserver, repo-updater
2. Cody: embeddings (but should eventually be @sourcegraph/search-platform, along with all embeddings alerts: https://github.com/sourcegraph/sourcegraph/pull/58474#issuecomment-1821505062)

Source is an active owner based on [thread](https://sourcegraph.slack.com/archives/C0652SSUA20/p1700592165408089?thread_ts=1700549423.860019&cid=C0652SSUA20), and Cody is a fairly recent addition so hopefully it's valid.
I'm not sure the Search one is still up-to-date, so I didn't change some of the obvious search services - for now, these still point to DevOps as they did before. If it becomes problematic we can revisit later.
Looks like GitHub.com has become more lenient, or transparent on their docs page: https://docs.github.com/en/rest/overview/rate-limits-for-the-rest-api?apiVersion=2022-11-28#about-secondary-rate-limits. The paragraph about single request per token is gone from this page! Instead, they describe secondary rate limits quite well now:

```
You may encounter a secondary rate limit if you:

Make too many concurrent requests. No more than 100 concurrent requests are allowed. This limit is shared across the REST API and GraphQL API.
Make too many requests to a single endpoint per minute. No more than 900 points per minute are allowed for REST API endpoints, and no more than 2,000 points per minute are allowed for the GraphQL API endpoint. For more information about points, see "Calculating points for the secondary rate limit."
Make too many requests per minute. No more than 90 seconds of CPU time per 60 seconds of real time is allowed. No more than 60 seconds of this CPU time may be for the GraphQL API. You can roughly estimate the CPU time by measuring the total response time for your API requests.
Create too much content on GitHub in a short amount of time. In general, no more than 80 content-generating requests per minute and no more than 500 content-generating requests per hour are allowed. Some endpoints have lower content creation limits. Content creation limits include actions taken on the GitHub web interface as well as via the REST API and GraphQL API.
```

So the limit is no longer 1, it is roughly 100. Well, that depends on what APIs you’re calling, but whatever. Strangely, in the best practices section they still say that 1 request is advised, I followed up with a support ticket with GitHub to clarify.

### Outcome

They said 100 is the limit but for certain requests the number can be lower. This doesn't convince us (team source) that it's worth keeping it.

Besides, they also document that they return a Retry-After header in this event and we already handle that with retries (if the retry is not in the too distant future). So.. I want to say that this is “no different than any other API” at this point. Sure, there are some limits that they enforce, but that’s true for all the APIs. The 1-concurrency only one was quite gnarly which totally justified the GitHub-Proxy and now the redis-based replacement IMO, but I don’t think with the recent changes here it does warrant a github.com-only special casing (pending talking to GitHub about that docs weirdness), and instead of investing into moving the concurrency lock into the transport layer, I think we should be fine dropping it altogether.
This PR proposes a new pattern for instantiating gitserver clients.
When we instantiate a new gitserver client, we should pass in a scope, a description of the environment it's used in.
When a client is passed down to an environment, we can augment the client with an additional scope.

What is this for?

Looking at Grafana charts for dotcom, we see that we make about 2000 requests per second to gitserver. We know what endpoints we're hitting, and what _container_ is making the request.
In Sourcegraph, containers are not a great boundary for services though. Some components stretch across multiple containers, and one container runs many different components, for example our worker container.
While there are probably at least 50 routines owned by various different teams in that container, our current metrics only tell us that worker is making a large amount of requests.
But we don't know who to talk to about it, because, again, worker is basically every team.

With scopes, we get more fine-grained insights and can group the metric by (container, op, scope), to get full insight into what _component_ (not _container_) is talking to gitserver.
This is the end of the PR train to remove the enterprise directory from out repo since we have consolidated to use a single license.

Bye rough code split :)
Whether we remove email org invitations or not, this code is currently not used and increases our ownership surface area, thus I'm removing it here. We can always revert, should we need it again.
Part of https://github.com/sourcegraph/sourcegraph/issues/56970 - this adds some dashboards for the export side of things, as well as improves the existing metrics. Only includes warnings.
## Test plan
Had to test locally only because I ended up changing the metrics a bit, but validated that the queue size metric works in S2.
Testing locally:
```yaml
# sg.config.overwrite.yaml
env:
TELEMETRY_GATEWAY_EXPORTER_EXPORT_INTERVAL: "30s"
TELEMETRY_GATEWAY_EXPORTER_EXPORTED_EVENTS_RETENTION: "5m"
TELEMETRY_GATEWAY_EXPORTER_QUEUE_CLEANUP_INTERVAL: "10m"
```
```
sg start
sg start monitoring
```
Do lots of searches to generate events. Note `telemetry-export` feature flag must be enabled
Data is not realistic because of the super high interval I configured for testing, but it shows that things work:

This changes the threshold to critical-alert on 10% failure rate, and warn on any non-zero failure rate (as all email delivery failures impact user experience).
This service is being replaced by a redsync.Mutex that lives directly in the GitHub client.
By this change we will:
- Simplify deployments by removing one service
- Centralize GitHub access control in the client instead of splitting it across services
- Remove the dependency on a non-HA service to talk to GitHub.com successfully

Other repos referencing this service will be updated once this has shipped to dotcom and proven to work over the course of a couple days.