mirror of
https://github.com/onedr0p/exportarr.git
synced 2026-02-06 10:57:32 +00:00
| .. | ||
| dashboard2.json | ||
| dashboard.json | ||
| README.md | ||
Dashboard Examples
Dashboard 1
Dashboard 1 covers Radarr -- this is the image which is displayed on the main README.

Dashboard 2
Dashboard 2 covers Prowlarr, Sabnzbd, Radarr, Sonarr, Lidarr, Readarr.
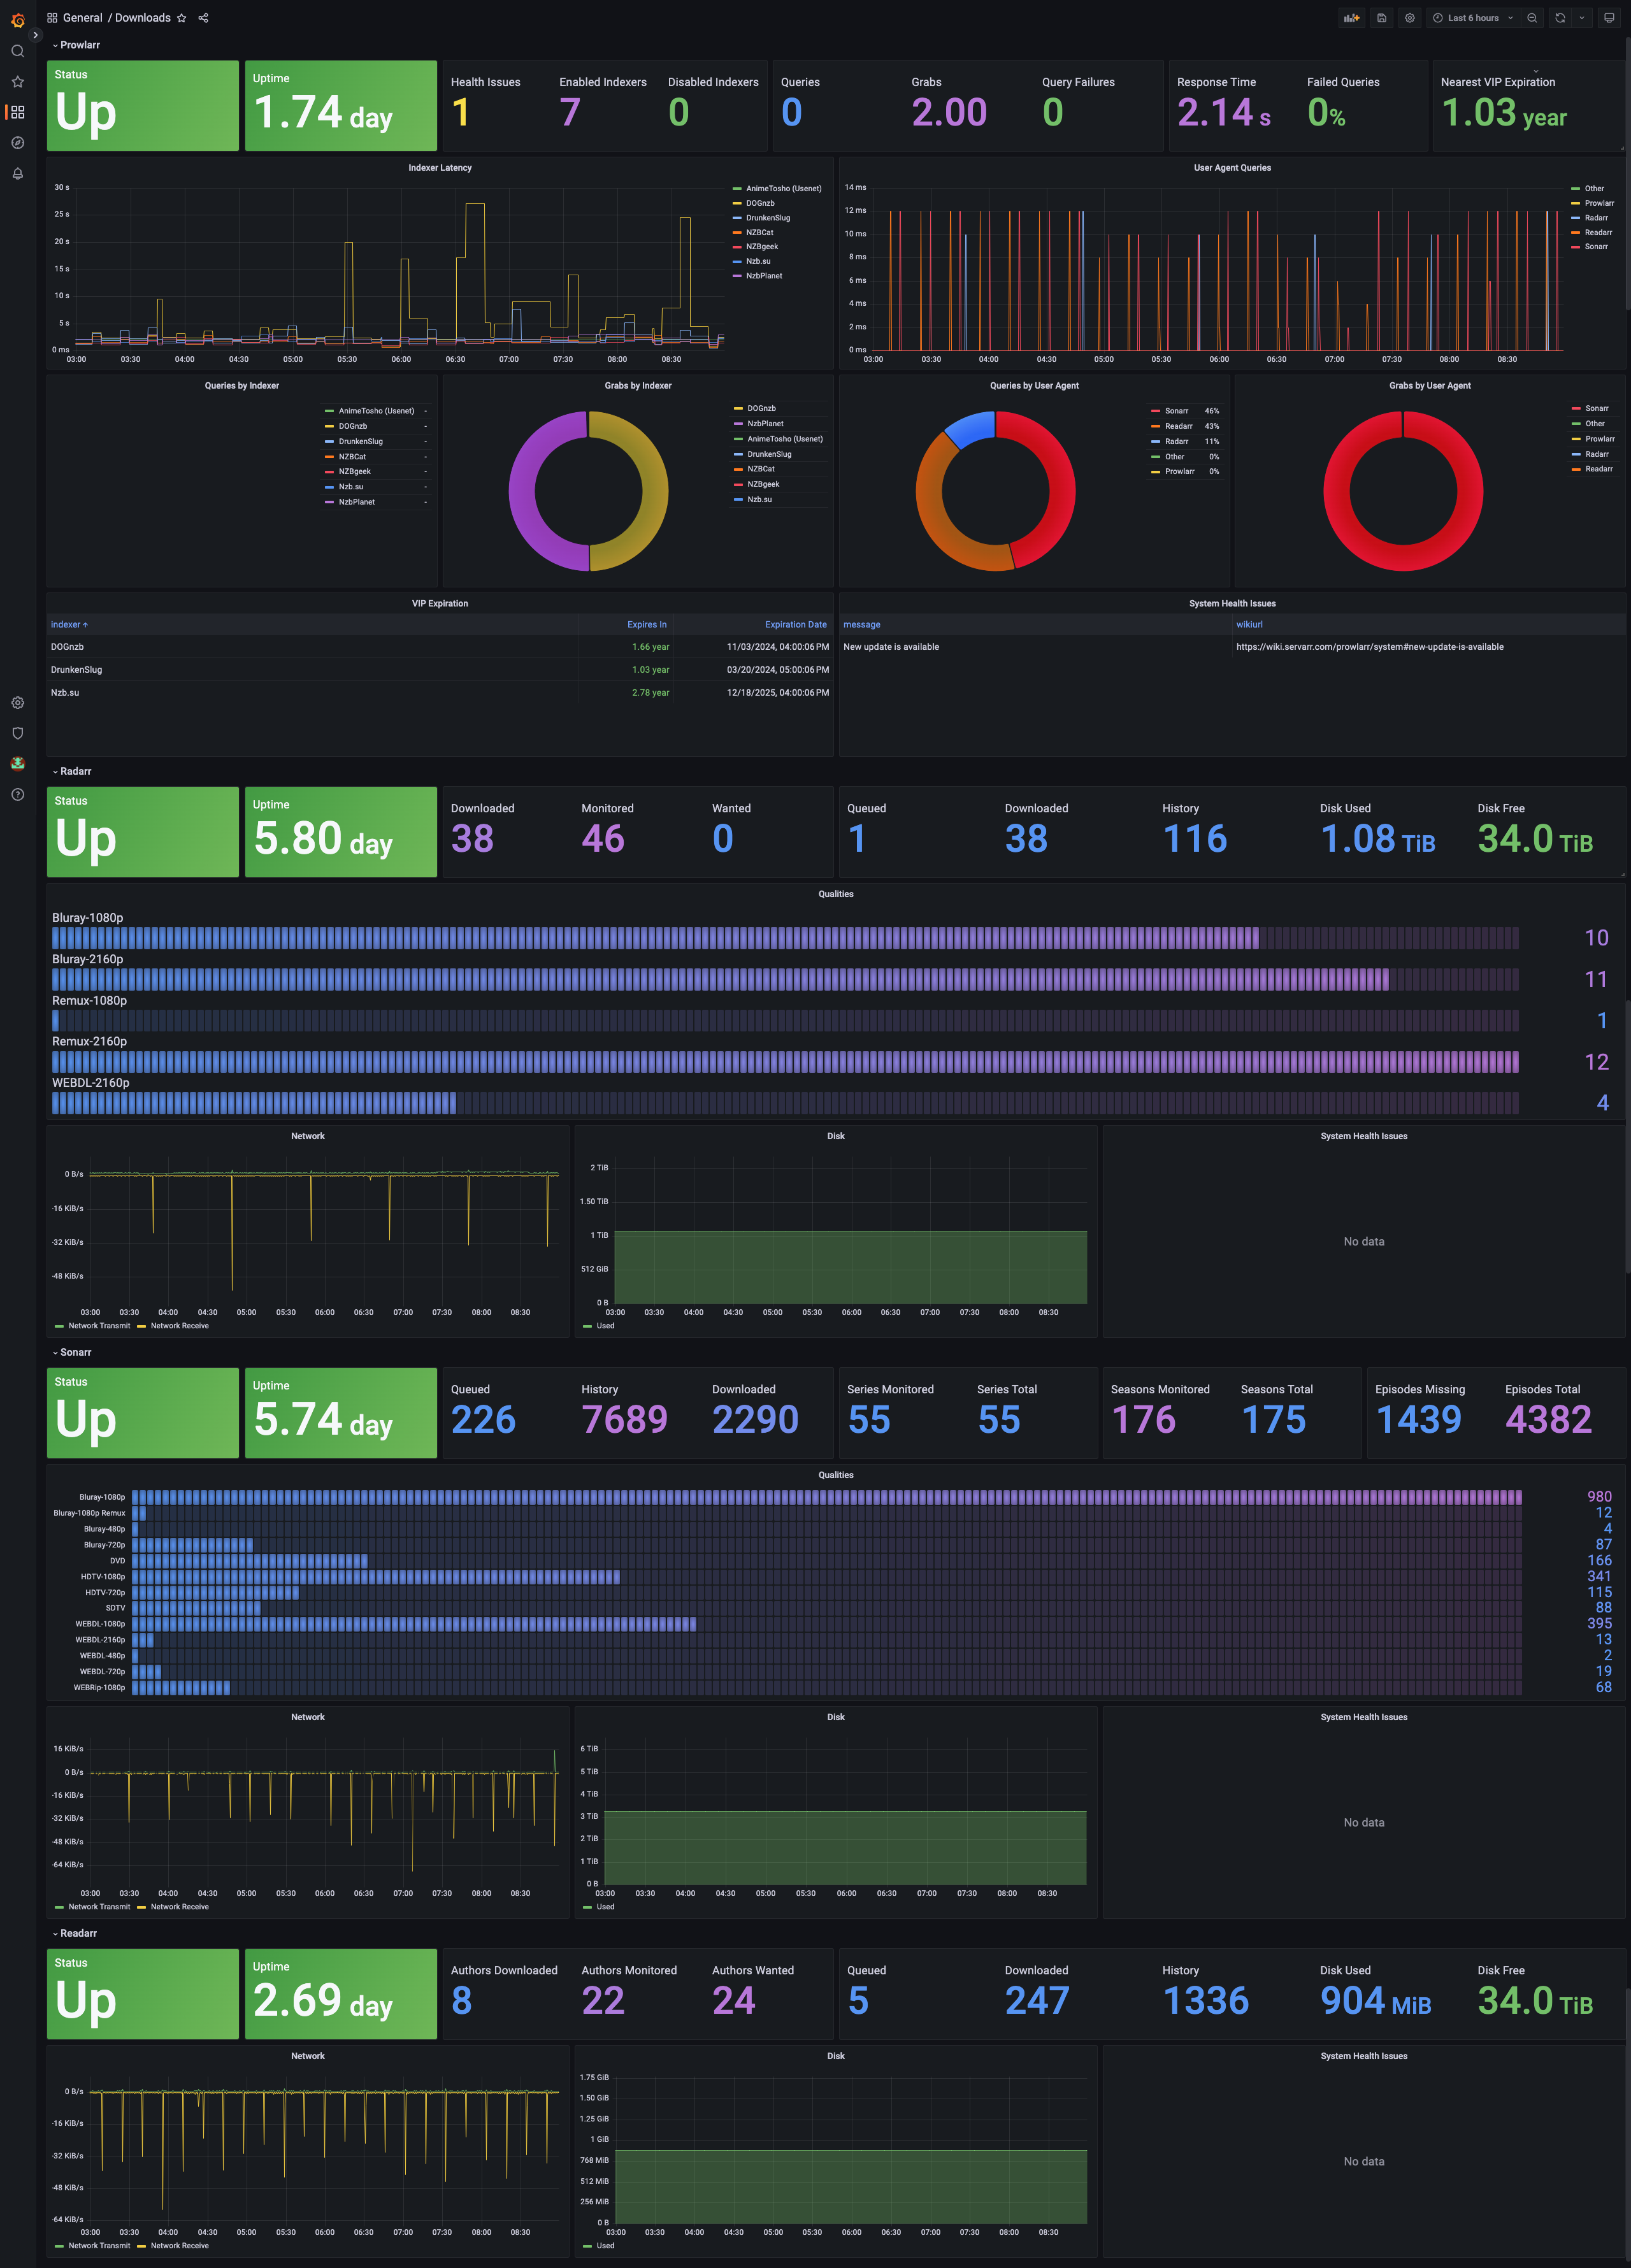
Notes:
- This dashboard was built assuming these services are running kubernetes, so the
UptimeandNetworkpanels assume kubernetes prometheus metrics are available. In other environments these will need to be delete/edited.